
Interactive diagnostic test statistics
I’ve been watching a lot of coding train, and it has got me keen to do something with the javascipt library P5.js. My housemate has been learning about diagnostics as part of her veterinary degree, so I decided to combine the two and make an interactive application for understanding diagnostic statistics.
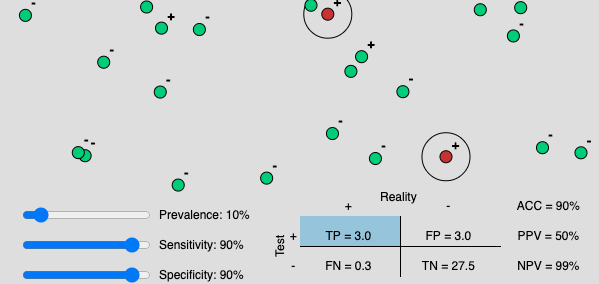
Red/green circles are diseased/healthy individuals, and the plus/minus indicates a positive/negative test result. Full code can be found on github.
Diagnostics
Sensitivity and specificity are intrinsic measures of performance and described how the results of a test compare to reality. The portion of results that are correctly identified as positives and negatives are know as the sensitivity (True Positive Rate) and specificity (True Negative Rate), respectively.
While sensitivity and specificity are important concepts, they are not as valuable (from a practical standpoint) as the often-overlooked concepts of positive (PPV) and negative (NPV) predictive value. These values describe how believable the results of a diagnostic test are, and thus directly influence clinical decision making.
Unlike sensitivity and specificity, PPV and NPV change with prevalence. A test that has low sensitivity incorrectly identifies positive individuals as negatives (Type 2 error). This test will have a higher NPV (i.e. you can be confident in the negative results) when the prevalence is low. You are less likely to misclassify a positive as a negative because the majority of individuals in the population are disease-free anyway.
When testing in a high prevalence population with a low sensitivity assay, the NPV is low because there are more diseased individuals to be misclassified by the low sensitivity test.
The opposite is true for specificity and PPV, i.e. when specificity and prevalence are low, so is PPV. A diagnostic test with low specificity incorrectly identifies negative individuals as positive (Type 1 error). When prevalence is low, there are more disease-free individuals in the population, and so a test with low specificity incorrectly classifies more individuals positive.
Try playing with the sliders in the app above to get a feeling of how this works.
This wiki page has more information on how these values are calculated and relate.
P5.js
p5.js is a JavaScript library for creative coding, with a focus on making coding accessible and inclusive for artists, designers, educators, beginners, and anyone else! p5.js is free and open-source because we believe software, and the tools to learn it, should be accessible to everyone. P5js website
This was my first time using P5.js, but I really like. It’s a simple yet powerful visualisation library. There’s a free web editor so you can get started right away. I wrote the above application in the web editor by forking this project of bouncing balls.
Comments